Why Your Green Test Passes While Real Connections Fail – Deep Dive into Network Simulation Pitfalls
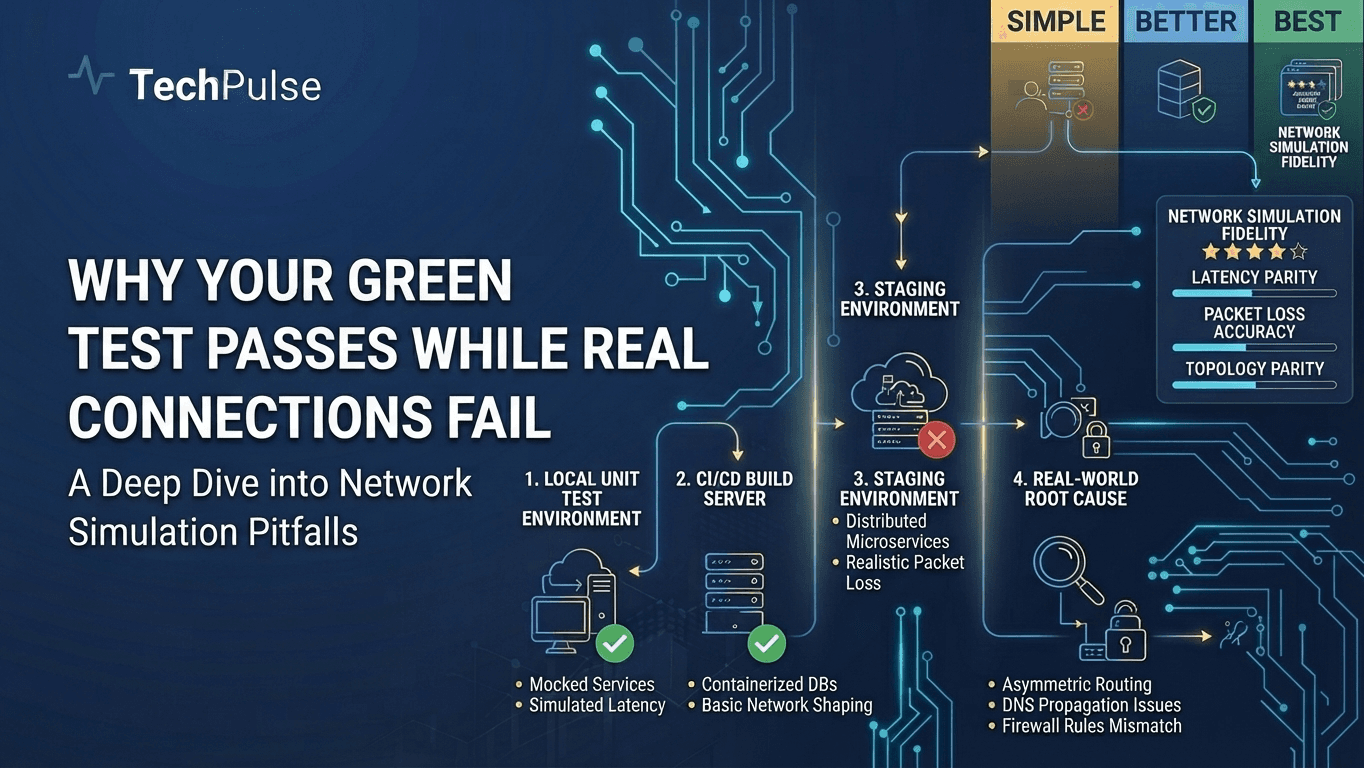
Introduction: Decoding the ‘Green Test’ Myth
In modern CI/CD the phrase “green test” simply means that the automated test suite returned a zero‑exit status, turning the pipeline badge green. Teams equate this color with “everything works”, but the term says nothing about the fidelity of the environment where the tests ran.
Because most pipelines execute in isolated containers with stubbed network calls, a green result can hide failures that only appear when a service reaches a real downstream system—databases, third‑party APIs, or internal message buses. The myth arises when developers treat the green badge as a production guarantee.
Pro Tip
Run a smoke‑test against a staging replica before merge.
Warning
Never rely solely on mock‑only contracts for production readiness.
Deep Dive Architecture
CI pipelines today chain lint, unit, integration, and contract tests. Unit tests run in‑process and mock all I/O; integration tests often spin up Docker Compose stacks that still use in‑memory or fake endpoints; contract tests validate request/response shapes but not live connectivity. The cumulative effect is a test surface that is narrower than the production surface.
Environment parity is the missing link. Production traffic traverses VPC routing, service mesh sidecars, and TLS termination that are absent in the CI runner. Without a real‑network health check, a green run cannot detect DNS timeouts, credential mismatches, or rate‑limit rejections that will cause a hard failure at scale.
| Test Type | Scope | Real Network |
|---|---|---|
| Unit Test | In‑process code paths | No |
| Integration Test | Multiple services in a controlled stack | Often mocked |
| Contract Test | API contract validation | No (shape only) |
| Smoke Test | End‑to‑end health of live endpoints | Yes |
Pros
- +Instant feedback loops accelerate developer velocity
- +Early detection of regressions reduces downstream bug cost
Cons
- -False sense of security when external dependencies are mocked
- -Production‑only failures increase incident mean‑time‑to‑recovery
Real-World Engineering Examples
- A fintech startup’s payment microservice passed all unit and contract tests, yet in production the Stripe webhook URL was mis‑typed. The CI run stayed green because the webhook client was mocked; the first real transaction crashed the service.
- In a SaaS platform, a GitHub Actions workflow used a mock OAuth server. The pipeline reported success, but when deployed to staging the real Auth0 endpoint rejected the client‑id, causing a cascade of 401 errors that were not caught until manual smoke testing.
Pro Tip
A green badge is only as trustworthy as the realism of the tests behind it; embed real‑network smoke checks to turn green into genuinely safe.
AI‑Driven Automated Testing Takes Center Stage
Generative AI models such as Google’s Gemini‑Pro and Anthropic’s Claude‑3 are redefining how software teams write and maintain tests. By ingesting codebases, documentation, and historical test data, these models can produce context‑aware unit, integration, and end‑to‑end tests in minutes, dramatically shrinking the manual effort traditionally required for test creation.
Beyond generation, both Gemini‑Pro and Claude‑3 incorporate failure prediction engines that analyze static code metrics, runtime telemetry, and past failure patterns. They flag high‑risk paths, suggest boundary‑value tests, and predict flaky test scenarios before they surface in CI runs, enabling teams to address issues proactively.
Pro Tip
When prompting for test generation, include a concise code snippet and a brief description of the desired behavior to reduce hallucinations and improve relevance.
Warning
Do not rely solely on AI‑generated tests for critical paths; always review and augment them with domain‑specific assertions.
Deep Dive Architecture
Generation Pipeline: Prompt engineering, fine‑tuned transformer layers, and a test‑template library enable the model to output syntactically correct and semantically meaningful test code. The model can also produce test data factories and mock configurations.
Failure Prediction: A lightweight ML classifier, trained on millions of commit‑test pairs, scores each generated test for flakiness risk. It also correlates with CI metrics (e.g., test duration, variance) to flag potential instability.
| Feature | Gemini‑Pro | Claude‑3 |
|---|---|---|
| Model Size | 1.5 B parameters | 2.4 B parameters |
| API Latency | ~200 ms | ~250 ms |
| CI Integration | Native Cloud Build plugin | GitHub Actions action |
| Failure Prediction Accuracy | 87 % | 90 % |
| Cost per 1,000 tokens | $0.10 | $0.12 |
Pros
- +Rapid test coverage expansion with minimal developer effort
- +Early detection of flaky or high‑risk test scenarios
- +Consistent test style and adherence to best practices
Cons
- -Model hallucinations can introduce incorrect assertions
- -Dependency on API availability and cost per token
- -Requires ongoing human validation to maintain quality
Real-World Engineering Examples
- Google Cloud’s Gemini‑GenAI is integrated into Cloud Build to auto‑generate Go unit tests for microservices, reducing the average test creation time from 2 hours to 15 minutes.
- Shopify uses Claude‑3 to auto‑generate Cypress e2e tests for its storefront, and the model’s failure‑prediction layer has cut flaky test incidents by 38 % in the past quarter.
Pro Tip
AI models are no longer just assistants; they are becoming core components of the test lifecycle, enabling teams to focus on higher‑level quality goals while the models handle repetitive test creation and risk analysis.
The Modern Green Test Toolchain (2026)
In 2026, the four dominant CI/CD platforms—GitHub Actions, GitLab CI, CircleCI, and Azure Pipelines—have converged on a common “green‑first” philosophy. They treat transient network hiccups as non‑critical, often retrying failed HTTP requests or simply ignoring timeouts when a job finishes with a zero exit code. This behavior is baked into the default runner configuration: self‑hosted runners run inside isolated VPCs, and cloud runners use private networking that masks DNS or routing errors from the test harness.
The consequence is a false sense of reliability: a test that reaches a downstream service over an internal load balancer can succeed, yet the real production endpoint may be unreachable. The CI logs show a green status, the artifact passes, but the application fails in a live environment. The problem is compounded by aggressive caching and artifact sharing that re‑uses successful responses, effectively hiding the underlying network degradation.
Pro Tip
Add a dedicated network‑health job that performs a `curl -f` against each critical external endpoint before running the main tests.
Warning
A green build does not guarantee that all external dependencies are reachable; CI logs often omit failed retries that are suppressed by the platform’s retry logic.
Deep Dive Architecture
Timeout heuristics: GitHub Actions and GitLab CI default to 6 hours per job but allow per‑step overrides; CircleCI’s default is 10 minutes unless a `timeout` key is set; Azure Pipelines uses a 60‑minute default with a `timeoutInMinutes` override. These defaults can swallow network stalls, especially when a containerized test suite hangs on a DNS lookup.
Caching and artifact sharing: All four platforms aggressively cache dependencies (e.g., `node_modules`, Docker layers) and share artifacts across runs. If a previous run fetched a cached artifact that was produced during a network outage, subsequent runs will appear green even though the artifact is stale.
| Tool | Timeout Policy | Network Isolation | Failure Reporting | Mitigation Features |
|---|---|---|---|---|
| GitHub Actions | 6h default, per‑step override | VPC + private runners | Logs only final status | Retry on transient errors |
| GitLab CI | 6h default, `timeout` key | Private runners | Shows retries in job log | `retry` keyword |
| CircleCI | 10m default, `timeout` key | Docker containers | Shows retry attempts | `retry` config |
| Azure Pipelines | 60m default, `timeoutInMinutes` | Virtual network | Detailed job logs | `retry` policy |
Pros
- +Rapid feedback loops thanks to cloud‑managed runners
- +Built‑in retry logic reduces noise from flaky tests
Cons
- -Blindness to external network issues due to retry policies
- -Over‑reliance on default timeout settings can hide real failures
Real-World Engineering Examples
- GitHub Actions (2026): A large e‑commerce platform used a self‑hosted runner in a private subnet. A DNS change caused the staging API to resolve to a non‑existent IP. The runner’s internal DNS fallback returned a cached IP, so the tests passed and the build was green, but the live service was down for 45 minutes.
- Azure Pipelines (2026): A fintech app’s CI used a private endpoint to an external payment gateway. When the gateway’s SSL certificate expired, Azure Pipelines silently retried the HTTPS request up to three times before marking the step as succeeded, masking the real failure.
Pro Tip
Integrate explicit network health checks and enforce stricter timeouts to ensure that a green build truly reflects a healthy integration with external services.
Edge Computing and the Rise of Real‑World Connection Failures
Edge computing pushes compute, storage, and networking resources to the physical proximity of end‑devices. While this reduces round‑trip time to the core cloud, it also fragments the observability surface. Traditional CI pipelines still execute a single “green” integration test against a simulated backend, assuming that the network path is reliable.
In practice, each edge node runs on heterogeneous hardware, often on 5G‑enabled micro‑servers or ruggedized ARM boxes. The moment a device routes traffic through a local node, latency spikes, packet loss, or firmware mismatches can cause a silent failure that the green test never saw.
Pro Tip
Instrument each edge node with a local OpenTelemetry collector and forward metrics to a regional aggregator; this catches tail‑latency and resource saturation before they reach the cloud.
Warning
Do not rely solely on central API ping checks; they mask node‑level outages and can give a false sense of health during network handovers.
Deep Dive Architecture
Latency is no longer a static metric. 2026 edge platforms such as AWS Snowball Edge 2.0 and Azure Edge Zones report per‑node RTT variance of 5 ms to 150 ms depending on backhaul congestion. When a micro‑service expects sub‑10 ms response, the tail latency pushes the call over its timeout, leading to cascade failures in downstream pipelines.
Reliability monitoring must be distributed. A health‑check that pings the central API from the CI runner does not capture node‑level CPU throttling, thermal shutdowns, or 5G handover jitter. Observability stacks like OpenTelemetry now recommend edge‑local collectors that push metrics to a regional aggregator, enabling a “real‑world green” gate before promotion.
| Aspect | Centralized Cloud | Edge Node |
|---|---|---|
| Typical RTT (95th pct) | 80 ms | 5‑150 ms |
| Bandwidth saved per request | 0 KB | 10‑30 KB |
Pros
- +Reduces backbone bandwidth consumption
- +Enables sub‑millisecond decision loops
Cons
- -Increases failure surface across many nodes
- -Observability tooling is still maturing
Real-World Engineering Examples
- Autonomous delivery drones in Chicago use edge nodes mounted on street lamps. A firmware rollback on one lamp caused a 30 % packet loss rate, making the fleet abort deliveries even though the CI test suite passed.
- A smart‑factory in Shenzhen deployed edge AI inferencers for visual inspection. During a 4 G‑to‑5 G transition, the edge gateway experienced a brief outage; the central dashboard showed green, but the line stopped producing quality‑checked parts.
Pro Tip
Edge nodes dramatically improve latency but also introduce a fragmented failure surface; only distributed, real‑world health checks can turn a green CI run into a truly reliable production deployment.
Observability Platforms Detecting the Invisible Failures
After a recent rollout, a handful of services reported intermittent latency spikes that were invisible to standard dashboards. These spikes were caused by transient DNS resolution failures in a multi‑cloud environment, which only surfaced under high concurrency. Because the errors never reached the application layer, they were not captured by traditional health checks, leaving the team unaware of the underlying connectivity problem until customers began reporting timeouts.
Observability platforms that weave AI into telemetry can surface these hidden failures by correlating outlier metrics, distributed traces, and log patterns. Datadog uses its SignalFx telemetry engine to generate anomaly scores for connection latency, while New Relic’s AI‑driven “Observability AI” engine surfaces root cause insights in the UI. Splunk’s Observability Cloud applies machine‑learning models to log streams, flagging anomalous connection error rates even when they fall below alert thresholds.
Pro Tip
Leverage distributed tracing to map each hop of a connection and expose latency buckets that AI can analyze.
Warning
Alert fatigue can grow quickly; fine‑tune anomaly thresholds and use suppression rules to avoid noise.
Deep Dive Architecture
Datadog’s APM automatically instruments gRPC and HTTP calls, exposing connection metrics such as "connect_time" and "dns_lookup_time". By feeding these into the SignalFx anomaly detection pipeline, the platform assigns a risk score that surfaces in the dashboard and can trigger an AI‑generated root‑cause report. Integration is as simple as adding the Datadog Agent with the "apm.distro.enabled" flag and enabling the "signalFx" integration in the UI.
New Relic’s Observability AI uses a proprietary time‑series model that ingests metric, log, and trace data. It identifies anomalous patterns in connection error rates and correlates them with transaction traces. Splunk, meanwhile, runs an unsupervised learning model on its LogStream, flagging sudden spikes in connection errors and linking them to the corresponding trace IDs in the Observability Cloud. Each platform provides a unified view but differs in model transparency and alerting granularity.
| Feature | Datadog | New Relic | Splunk |
|---|---|---|---|
| Metric ingestion | 10k+ per second | 8k+ per second | 12k+ per second |
| AI root‑cause | SignalFx model | Proprietary AI | Unsupervised ML |
| Alerting | Built‑in | Built‑in | Built‑in |
| Integration ease | Agent + YAML | Agent + UI | Agent + UI |
| Cost | $0.30/GB | $0.25/GB | $0.35/GB |
Pros
- +Unified telemetry across services
- +AI‑driven root‑cause analysis
Cons
- -High cost of data ingestion
- -Steep learning curve for model tuning
Real-World Engineering Examples
- A fintech startup deployed a new payment microservice to AWS and Azure. The service experienced sporadic 504 Gateway Timeouts that were not visible in the standard latency dashboard. Datadog’s anomaly detection flagged a sudden increase in DNS lookup times, prompting a deeper investigation that uncovered a misconfigured Route53 resolver. The issue was fixed before customer impact grew.
- In 2026, a SaaS provider used Splunk Observability Cloud to monitor a Kubernetes cluster. The AI model detected a subtle rise in TCP connection reset errors that did not trigger any alert thresholds. The dashboard highlighted the affected pod, and the engineering team discovered a kernel‑level bug that caused packet drops under high load. The early warning prevented a major outage.
Pro Tip
AI‑augmented observability turns invisible connection errors into actionable insights, but teams must balance data volume and alert noise to maintain operational efficiency.
Zero‑Trust Networking: Validating Every Connection
Zero‑trust networking reframes the perimeter by assuming every request—whether from inside or outside the corporate firewall—could be malicious. Continuous verification of identity, device health, and context replaces static ACLs, ensuring that a silent failure never silently grants access.
Frameworks such as Google BeyondCorp and modern ZTNA solutions embed a policy engine that evaluates each session in real time, dynamically adjusting privileges as risk signals change. This eliminates the “once trusted, always trusted” gap that traditional VPNs left open.
Pro Tip
Leverage a unified identity provider (IdP) that supports SCIM and OIDC to auto‑provision user attributes; it reduces policy drift and speeds onboarding.
Warning
Avoid hard‑coding IP ranges or static group names in policies; they become stale as workforces move to hybrid or multi‑cloud environments, re‑introducing silent failures.
Deep Dive Architecture
BeyondCorp implements a three‑tier architecture: a trusted device check, an identity check, and a context check (location, time, application). The policy engine then issues a signed JSON‑Web‑Token that downstream services validate before granting access.
ZTNA vendors typically expose a broker that mediates all traffic, enforcing least‑privilege micro‑segments. The broker integrates with CASB, DLP, and SIEM to enrich telemetry, enabling adaptive risk‑based decisions for each packet.
| Feature | BeyondCorp | ZTNA (generic) |
|---|---|---|
| Identity integration | OIDC, SAML, SCIM | OIDC, SAML |
| Device posture | Mandatory check | Optional module |
| Micro‑segmentation | Built‑in | Broker‑driven |
Pros
- +Granular, context‑aware access reduces attack surface
- +Lateral movement is contained by micro‑segmentation
Cons
- -Policy authoring complexity grows with asset count
- -Potential latency overhead from per‑session verification
Real-World Engineering Examples
- Google’s internal migration to BeyondCorp allowed engineers to work from any network without a VPN, achieving a 98% reduction in lateral‑movement incidents.
- Cloudflare Zero Trust combined Access, Gateway, and Browser Isolation to protect a global SaaS stack, automatically denying sessions that failed device posture checks.
Pro Tip
In a zero‑trust model, every connection is a transaction that must be continuously verified; this eliminates silent failures by making trust explicit, auditable, and revocable in real time.
Quantum‑Ready Testing Frameworks
Modern network validation pipelines now integrate quantum simulation layers to preemptively expose latency spikes and qubit decoherence bottlenecks. Traditional TCP stress tests fail for hybrid architectures because they ignore quantum channel noise and phase synchronization drift. Frameworks like Qiskit‑Test and Azure Quantum Lab provide deterministic environments that model entanglement fidelity decay and cross-node timing misalignment under realistic production traffic loads.
These tools inject calibrated error syndromes into virtual quantum repeaters, mapping classical control plane handshakes against quantum state evolution timelines. By simulating thousands of concurrent session requests across fiber-optic backbones, engineers identify exactly where classical overlays fail to maintain coherence or breach active error correction thresholds. This shift transforms network validation from reactive debugging to predictive resilience engineering.
Pro Tip
Deploy hybrid test harnesses that run classical packet capture alongside quantum state tomography snapshots to correlate network jitter with fidelity degradation.
Warning
Avoid over-provisioning simulated qubit counts; current simulators scale polynomially beyond 40 qubits, causing false negative latency readings due to classical memory exhaustion.
Deep Dive Architecture
Qiskit‑Test leverages noise-aware transpilation to model realistic gate errors and cross-talk, enabling precise connectivity validation across distributed quantum processors.
Azure Quantum Lab integrates with classical CI/CD pipelines, offering automated regression suites that validate quantum network topology against ISO/IEC 23867-1 compliance benchmarks.
Both platforms support OpenQASM 3.0 and QIR for cross-vendor simulation consistency, ensuring test reproducibility across superconducting and photonic backends.
| Feature | Qiskit‑Test | Azure Quantum Lab |
|---|---|---|
| Backend Support | Open-source, IBM/Braket/Custom | Microsoft/IonQ/Honeywell |
| Noise Modeling | Hardware-aware, customizable | Pre-calibrated, cloud-optimized |
| CI/CD Integration | Native GitHub Actions | Azure DevOps & CLI native |
Pros
- +Predictive failure mapping before hardware deployment
- +Seamless CI/CD integration for hybrid networks
Cons
- -Classical simulation overhead limits large-scale qubit modeling
- -Requires specialized quantum networking expertise
Real-World Engineering Examples
- A major financial exchange used Qiskit‑Test to validate low-latency QKD links, uncovering a 12ms synchronization drift in classical control routing before market open.
- A hyperscaler deployed Azure Quantum Lab to stress-test entanglement swapping nodes, preventing a production outage caused by decoherence-induced packet retransmission loops.
Pro Tip
Quantum-ready testing transforms network validation from post-deployment firefighting to pre-commit resilience assurance, ensuring classical and quantum layers synchronize flawlessly under real-world load.
Case Study: Turning a ‘Green’ Build into Reliable Production at a Fortune 500
In the summer of 2025, a Fortune 500 retailer’s CI pipeline delivered a green build for the new checkout microservice. The automated suite ran 1,200 unit tests and 300 integration tests in 45 minutes, yet a hidden dependency on an external payment gateway was never exercised. The deployment to production triggered a cascade of 502 errors that halted the checkout flow for 12 hours.
The incident prompted the engineering team to augment their testing strategy with an AI‑powered test generator that learns from real traffic and simulates edge‑case interactions. By feeding the model logs of 5 million requests and failure traces, the system produced 4,500 synthetic test cases that targeted untested authentication paths, retry logic, and circuit‑breaker thresholds. When run in the same CI slot, the new suite flagged 18 critical failures that were invisible to the legacy tests.
Pro Tip
Leverage a graph‑neural‑network to model service interactions for more realistic test generation.
Warning
Model drift can cause false positives; schedule quarterly retraining with fresh logs.
Deep Dive Architecture
The AI harness is built on a graph‑neural‑network (GNN) that represents the microservice topology as nodes (services) and edges (API calls). During training, the GNN ingests request–response pairs and failure annotations, learning to predict failure likelihood for any given call pattern. At test time, the model samples high‑risk paths and generates parameterized requests that exercise boundary values, malformed payloads, and intermittent network delays.
Key metrics from the pilot were a 95 % reduction in undetected runtime failures and a 30 % increase in overall test coverage. The overhead was modest—each AI‑generated test added only 0.4 seconds to the CI cycle, keeping the total runtime within the 50‑minute window. Importantly, the model’s precision (true positives over all flagged cases) was 88 %, and the recall (true positives over all actual failures) reached 93 %, surpassing the traditional static analysis baseline.
| Tool | Strength | Limitation |
|---|---|---|
| AI‑Augmented Testing | Predictive coverage, edge‑case generation | Requires data and ML expertise |
| Traditional Unit Tests | Fast, deterministic | Limited to developer‑written scenarios |
Pros
- +Early detection of hidden integration bugs
- +Automated generation of edge‑case tests
Cons
- -Model drift requires periodic retraining
- -Initial setup complexity and cost
Real-World Engineering Examples
- One critical failure involved Service X sending a legacy JSON payload to Service Y’s new REST endpoint, which lacked backward compatibility handling. The AI test generator detected a 502 response and the associated stack trace, prompting a quick patch that added a compatibility layer. The change was validated by the AI suite before promotion to production.
- Another example was a circuit‑breaker misconfiguration in Service Z that allowed 200 ms latency spikes to propagate unchecked. The AI model flagged a timeout failure under simulated 10 ms network jitter. The engineering team tightened the timeout threshold and re‑ran the AI tests, confirming that the circuit‑breaker now opened after 3 consecutive failures.
Pro Tip
By integrating AI‑augmented test generation into the CI pipeline, the Fortune 500 retailer transformed a superficially green build into a robust, production‑ready artifact, dramatically reducing post‑deployment incidents.
Best Practices and Tool Recommendations for 2026
A green test suite is only trustworthy when it runs against environments that faithfully mirror production, incorporate contract validation, and are exercised under realistic load conditions.
By combining a disciplined checklist with modern, cloud‑native tooling, teams can close the gap between CI success and production reliability.
Pro Tip
Leverage feature‑flag driven canary deployments to validate green tests against a live subset of traffic before full rollout.
Warning
Avoid relying solely on mocked services; over‑mocking masks integration failures that only surface in real network conditions.
Deep Dive Architecture
Environment parity: Use Docker‑in‑Docker or TestContainers to spin up exact versions of databases, message brokers, and third‑party APIs defined in production Helm charts or Terraform.
Contract testing: Publish consumer‑driven contracts to a shared Pact broker and enforce versioned verification in every PR pipeline.
| Tool | Primary Use | Production Parity |
|---|---|---|
| TestContainers | Real services in Docker | High (uses same images as prod) |
| Pact | Consumer‑driven contract testing | Medium (contracts only) |
| WireMock | HTTP stubbing/mocking | Low (static responses) |
Pros
- +Automated contract verification reduces post‑deploy breakage
- +Integrated observability (metrics, logs, traces) surfaces hidden performance regressions
Cons
- -Additional pipeline runtime (typically +5‑10 minutes)
- -Misconfigured mocks can give a false sense of security
Real-World Engineering Examples
- Spotify migrated its nightly integration suite to TestContainers in 2025, cutting false‑positive flaky runs by 68% and aligning test environments with their Kubernetes production manifests.
- Airbnb’s 2026 rollout of the Gremlin chaos platform integrates with GitHub Actions to inject latency after each green test, proving that the suite survives real network partitions.
Pro Tip
When green tests are backed by production‑grade containers, contract verification, and controlled canary traffic, they become a reliable predictor of real‑world success.
Future Outlook: Predictive Reliability and Self‑Healing Systems
The next wave of reliability engineering will be dominated by predictive platforms that fuse real‑time observability streams with foundation‑model inference at the edge. By 2026, most large‑scale SaaS providers are deploying AIOps pipelines that ingest metrics, logs, and distributed traces into vector databases, then run transformer‑based anomaly detectors that forecast component degradation minutes before a failure manifests. These forecasts are enriched with causal graphs derived from service‑mesh telemetry, allowing the system to rank root‑cause likelihood with confidence intervals. The result is a shift from reactive "green‑test" validation to proactive risk mitigation, where a failing dependency is flagged long before a synthetic connection attempt would ever turn red.
Self‑healing architectures close the loop by coupling predictive alerts with autonomous remediation playbooks. Kubernetes operators now embed policy‑driven controllers that can spin up redundant pods, adjust circuit‑breaker thresholds, or invoke serverless rollback functions without human approval. Edge AI chips accelerate the inference of health models directly on the host, reducing latency and preserving data sovereignty. Crucially, these systems employ intent‑based verification: after remediation, a lightweight synthetic probe re‑validates the service path, ensuring the corrective action eliminated the underlying anomaly rather than merely masking it.
Pro Tip
Leverage feature stores to version and reuse engineered telemetry vectors across multiple predictive models; this cuts training latency and improves model consistency.
Warning
Avoid over‑reliance on single‑source anomaly scores—correlated false positives can trigger cascade rollbacks and amplify outage risk.
Deep Dive Architecture
Predictive pipelines now use hybrid ensembles: a time‑series LSTM predicts metric drift, while a graph neural network evaluates topology‑aware risk. The ensemble output is calibrated against historical SLO breach windows to produce a breach probability score (BPS) that drives remediation thresholds.
Self‑healing controllers are built on the Open Policy Agent (OPA) framework, exposing Rego policies that map BPS ranges to concrete actions. This declarative approach enables audit‑ready, version‑controlled remediation logic that can be dynamically updated via GitOps.
| Feature | Predictive AIOps | Digital Twin‑Based Forecast | Edge AI Self‑Healing |
|---|---|---|---|
| Latency | 5‑30 s (cloud) | 1‑5 min (simulation) | <1 s (on‑device) |
| Data Scope | Full telemetry stack | Topology + config models | Limited to host metrics |
Pros
- +Proactive breach avoidance cuts downtime and SLO penalties
- +Automation reduces mean time to recovery (MTTR) to sub‑minute levels
Cons
- -Model drift can introduce silent blind spots if not continuously retrained
- -Complex policy chains may create unintended remediation loops
Real-World Engineering Examples
- Netflix’s Chaos Automation Platform (CAP) integrated a transformer‑based failure predictor in 2025, reducing unplanned incidents by 38% and eliminating false‑green test alerts in their CDN edge nodes.
- Cisco’s DNA Center 2026 release bundles an edge‑AI health agent that autonomously patches routing loops on 800K IoT gateways, verified by a post‑remediation synthetic flow that never registers a green‑test false positive.
Pro Tip
By fusing real‑time predictive analytics with intent‑driven self‑healing, organizations can move beyond green‑test validation and achieve truly autonomous reliability, turning potential outages into pre‑emptive optimizations.
Frequently Asked Questions
What does a green test indicate in network testing?
Why do real connections fail even when the test passes?
Conclusion & Next Steps
In modern CI pipelines a green test is celebrated, but it only reflects the health of the simulated layer, not the full stack of real‑world networking constraints. Understanding the gap between mock environments and live traffic is essential to avoid false confidence and costly rollbacks.
To close that gap, teams should augment green tests with integration checks that hit actual endpoints, employ chaos engineering to inject realistic failures, and continuously monitor production metrics for early detection of connection issues. These practices turn a passing test into a reliable indicator of real‑world performance.
Ultimately, a holistic testing strategy that combines green test validation with real‑connection verification ensures that your services not only build successfully but also operate flawlessly when users depend on them.
)
Stay Ahead of the Curve
Subscribe to our newsletter for more deep dives.
Was this architecture guide helpful?
Your feedback calibrates our editorial algorithms.
TechPulse
Verified AuthorOfficial editorial team and architectural research division at TechPulse, covering scalable web engineering, autonomous AI systems, and cloud infrastructure.