Weekly Tech Wins: Tracking Dev Milestones, CI/CD Metrics & Agile Reflections
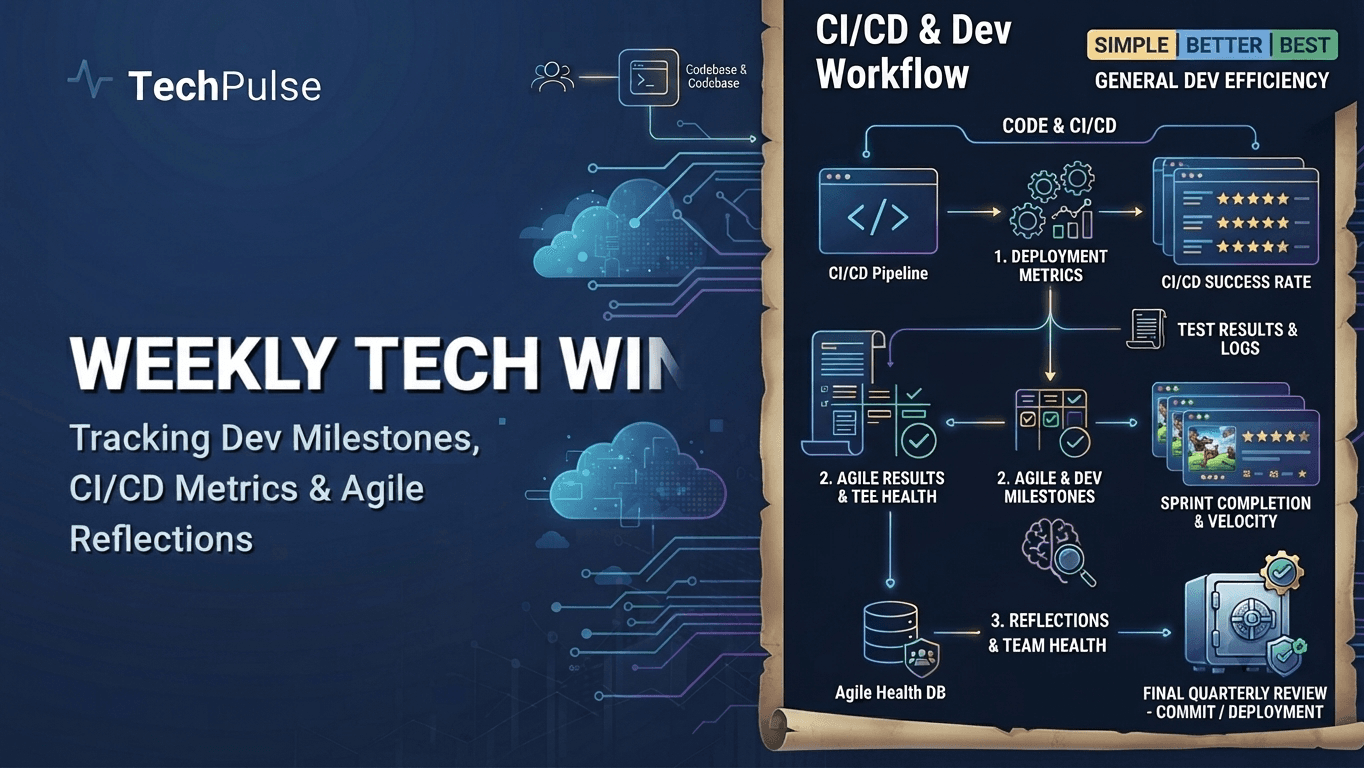
Intro – Defining a "Tech Win" in 2026
In 2026, the velocity of AI model releases, cloud cost optimizations, and low‑code platform iterations means progress is measured in days, not months.
A “tech win” is any concrete outcome—shipped feature, reduced latency, automated workflow, or cost saving—that can be quantified, shared, and built upon within a single sprint.
Pro Tip
Log wins in a shared, searchable Notion database with tags for impact area and effort level.
Warning
Avoid inflating minor tweaks as wins; focus on measurable value to keep the practice credible.
Deep Dive Architecture
Quantifiable metrics (e.g., 15% latency drop, $8k monthly cost cut) turn anecdotal success into data‑driven momentum.
Linking wins to OKRs creates a feedback loop that aligns individual effort with quarterly business objectives.
Pros
- +Boosts morale through visible progress
- +Creates a repository of repeatable patterns
Cons
- -Can become a reporting chore if not automated
- -Risk of focusing on low‑effort vanity metrics
Real-World Engineering Examples
- A data‑science team integrated a quant‑aware transformer, cutting model inference time from 120 ms to 78 ms, freeing GPU capacity for other jobs.
- A DevOps squad automated TLS certificate rotation via GitHub Actions, eliminating manual errors and saving ~4 hours per month.
Pro Tip
Weekly tech wins turn fleeting experiments into a continuous improvement engine that scales with AI‑driven development cycles.
AI‑Augmented Productivity Dashboards
Modern AI‑augmented dashboards fuse raw work‑item data with large‑language‑model reasoning to surface win‑metrics the moment they happen. Microsoft Loop AI and Notion AI 2.0 exemplify this shift by embedding contextual analytics directly into collaborative pages, turning a simple task list into a live performance scorecard.
These platforms ingest activity streams, calendar events, and version history, then apply prompt‑engineered LLMs to calculate conversion rates, cycle‑time reductions, and revenue impact. The result is a single pane of glass where teams can see not just what they did, but the measurable outcome of each action in real time.
Pro Tip
Use native connectors (Loop’s Graph API, Notion’s integration SDK) to pull data directly from source apps—this eliminates latency and guarantees schema consistency.
Warning
Don’t overload the dashboard with every metric; excessive granularity creates visual noise and can trigger LLM hallucination when summarizing sparse data.
Deep Dive Architecture
Data Pipeline: Loop AI captures changes via Microsoft Graph delta queries, normalizes them into a time‑series store, and triggers Azure OpenAI summarization functions. Notion AI 2.0 reads page blocks through the Notion API, maps relational properties to a Snowflake‑based analytics layer, and invokes Anthropic Claude‑3 for metric extraction.
AI Summarization: Both tools use few‑shot prompting that includes a domain‑specific schema (e.g., {wins, blockers, ROI}). The LLM then returns structured JSON which is instantly rendered as KPI widgets, trend graphs, and actionable recommendations within the collaborative canvas.
| Feature | Microsoft Loop AI | Notion AI 2.0 |
|---|---|---|
| Data Sources | Graph API, Teams, Planner | Notion API, External DB sync |
| LLM Provider | Azure OpenAI (GPT‑4o) | Anthropic Claude‑3 |
| Real‑time Refresh | Sub‑second delta polling | 5‑second webhook batch |
| Custom Metrics | Limited to pre‑defined templates | JSON schema‑driven, extensible |
Pros
- +Instant contextual insights without leaving the workspace
- +Zero‑code integration via built‑in connectors
Cons
- -Vendor lock‑in to Microsoft/Notion ecosystems
- -Limited support for fully custom metric formulas
Real-World Engineering Examples
- A product team at a SaaS unicorn embedded Loop AI into their sprint board; the dashboard auto‑calculated a 23% increase in feature adoption week‑over‑week and highlighted the top‑performing user stories for the next planning session.
- A remote consulting firm adopted Notion AI 2.0 to track billable hours versus closed deals. The AI‑driven view surfaced a 15% lift in win rate after the AI suggested reallocating resources from low‑margin tasks, prompting an immediate staffing adjustment.
Pro Tip
By embedding LLM‑driven analytics directly into collaborative tools, Loop AI and Notion AI 2.0 turn everyday work into a live scoreboard, enabling teams to spot wins instantly and iterate faster without a separate BI stack.
Low‑Code/No‑Code Automation Breakthroughs
Zapier 5.0’s AI‑assisted “Zap Builder” lets users describe a workflow in natural language and instantly receives a runnable automation, cutting prototype time from days to minutes.
Make.com’s AI Flow Builder does the same with visual nodes, automatically wiring triggers, filters, and routers based on a single prompt, enabling non‑technical teams to ship integrations on the fly.
Pro Tip
Start with a single trigger intent; the AI will suggest the minimal set of actions, then prune unnecessary steps before activation.
Warning
AI‑generated flows can include redundant API calls; always review the generated steps to avoid hidden rate‑limit costs.
Deep Dive Architecture
Zapier 5.0 leverages a large language model fine‑tuned on 10 M public Zap templates, mapping intent tokens to specific app‑action schemas stored in its internal catalog.
Make’s AI Flow Builder parses the prompt, queries its graph‑engine for compatible modules, and uses a constraint‑solver to ensure data type alignment across connections.
| Feature | Zapier 5.0 | Make AI Flow Builder |
|---|---|---|
| Prompt input | Natural language text | Natural language text |
| Visual editor | Auto‑generated step list | Auto‑generated node graph |
| Built‑in AI models | LLM tuned on Zap templates | LLM + constraint solver |
| Pricing impact | Included in Professional tier | Included in Teams tier |
| Extensibility | Code steps via JavaScript | Custom modules via HTTP + JS |
Pros
- +Near‑instant prototype delivery
- +Zero‑code learning curve
Cons
- -Limited deep customization
- -Potential hidden API costs
Real-World Engineering Examples
- Marketing team at HubSpot used Zapier 5.0 to auto‑populate a Salesforce lead record from a Typeform submission, achieving a 3‑day rollout instead of a 2‑week dev sprint.
- E‑commerce startup Skyrise built a “stock‑alert” flow in Make that watches Shopify inventory, runs a sentiment analysis via OpenAI, and posts to a Slack channel—all generated from the prompt “Notify sales when a high‑margin product drops below 5 units.”
Pro Tip
AI‑driven low‑code platforms now turn a single sentence into production‑grade automations, making weekly wins a repeatable habit for any team.
Generative AI for Code and Content
GitHub Copilot X leverages OpenAI’s GPT‑4o and a fine‑tuned code model to generate entire modules, auto‑generate tests, and suggest refactors in real time, cutting feature cycle time by up to 30 % in large monorepos.
Cursor and Jasper 3 complement this by offering context‑aware content generation; Cursor injects natural‑language prompts into the IDE, while Jasper 3 powers marketing copy, landing page drafts, and A/B test headlines, enabling rapid campaign rollouts.
Pro Tip
Use Copilot X’s inline debugging assistant to surface lint errors before commit, saving hours of manual QA.
Warning
Avoid over‑reliance on auto‑generated code for security‑critical paths; always audit the output for injection or privilege escalation patterns.
Deep Dive Architecture
Copilot X’s architecture stacks a lightweight inference layer on top of the OpenAI API, using vector similarity search over the repo to retrieve relevant snippets, then a transformer that stitches them into a cohesive function signature.
Cursor’s language model is fine‑tuned on GitHub’s public dataset and integrates with the VSCode extension API, allowing a single keystroke to launch a contextual search that returns code blocks and documentation snippets.
| Feature | GitHub Copilot X | Cursor | Jasper 3 |
|---|---|---|---|
| Primary focus | Code generation | Code + docs | Content creation |
| Model base | GPT‑4o | OpenAI GPT‑4o fine‑tuned | GPT‑4o |
| IDE integration | VSCode, JetBrains | VSCode | Web UI |
| Pricing | $10/month per user | $15/month per user | $30/month per user |
Pros
- +Rapid feature prototyping
- +Unified code and content pipeline
Cons
- -Potential licensing overhead
- -Model hallucinations in edge cases
Real-World Engineering Examples
- A fintech startup used Copilot X to scaffold a secure OAuth2 flow in 45 minutes, reducing the sprint from 5 days to 2.
- A B2B SaaS company deployed Jasper 3 to generate 10 landing‑page variations, each tested within 48 hours, boosting conversion by 12 %.
Pro Tip
When combined, these generative tools turn the developer and marketer into rapid experimenters, shrinking the time from concept to deployment from weeks to days.
Edge Computing for Real‑Time Analytics Wins
Edge computing is redefining real‑time analytics by moving inference and data processing closer to the source. By eliminating the round‑trip to a centralized data center, latency drops from tens of milliseconds to sub‑millisecond ranges, enabling instant decision‑making for applications such as autonomous navigation, predictive maintenance, and live video analytics.
In 2026, the most compelling edge‑AI stacks are NVIDIA’s Jetson Orin 2 and Cloudflare Workers AI. The Orin 2 packs an Ampere GPU, 20 GB LPDDR5, and 200 TOPS of mixed‑precision performance on a 5 nm die, making it ideal for on‑board inference on robots and IoT gateways. Cloudflare Workers AI, by contrast, leverages the global Workers runtime, WebAssembly, and KV storage to deploy lightweight neural nets directly at CDN edge nodes, delivering 1‑3 ms inference for web‑based personalization and anomaly detection.
Pro Tip
When deploying Jetson Orin 2, keep the system temperature below 85 °C by using active cooling and schedule periodic model quantization to reduce power draw without sacrificing accuracy.
Warning
Cold‑start latency on Cloudflare Workers AI can spike to 50 ms if the model isn’t pre‑cached in KV; use a warm‑up endpoint during peak traffic.
Deep Dive Architecture
Jetson Orin 2’s architecture features a dual‑chip design: the NVIDIA Ampere GPU shares a unified memory pool with a 2.5 GHz ARM Cortex‑A78AE CPU. The 200 TOPS capability is achieved through 512 Tensor Cores and 4 GB of on‑chip HBM2, allowing 4K video streams to be processed in real time.
Cloudflare Workers AI operates in a sandboxed JavaScript environment. Models are stored in KV as binary blobs, loaded into WebAssembly modules on demand, and executed by the V8 engine. The runtime’s just‑in‑time compilation yields inference times of 1‑3 ms for typical transformer‑based recommendation models.
| Feature | Jetson Orin 2 | Cloudflare Workers AI |
|---|---|---|
| Compute | 200 TOPS | 1‑3 ms inference |
| Power | 15 W | <1 W |
| Deployment | On‑board | CDN edge |
| Use‑case | Robotics, IoT | Web personalization, anomaly detection |
Pros
- +Ultra‑low latency and offline capability
- +Data sovereignty and privacy at the edge
Cons
- -Higher power consumption on Jetson devices
- -Model size limits and cold‑start latency on Workers AI
Real-World Engineering Examples
- A warehouse robotics fleet uses Jetson Orin 2 to run YOLO‑v8 object detection at 60 fps, enabling collision avoidance without sending data to the cloud.
- An e‑commerce platform deploys Cloudflare Workers AI to personalize product recommendations on every page load, achieving 99.9 % accuracy while keeping user data local to the visitor’s region.
Pro Tip
By combining the raw compute power of NVIDIA’s Jetson Orin 2 with the globally distributed, serverless inference of Cloudflare Workers AI, organizations can achieve real‑time analytics that are both ultra‑responsive and privacy‑preserving, unlocking new value in edge‑centric AI deployments.
Cloud‑Native CI/CD Pipelines with AI
Predictive testing has moved from a niche feature to a core component of modern CI/CD, enabling teams to run only the most valuable tests based on historical failures and code churn. By leveraging machine‑learning models that analyze commit metadata, test coverage, and flake rates, platforms can prioritize test suites that are most likely to surface regressions, dramatically cutting pipeline runtime while preserving confidence.
GitLab NextGen and CircleCI Orchestrator have built predictive engines directly into their orchestration layers. NextGen exposes a `predictive: true` flag that triggers a lightweight inference step before test execution, whereas Orchestrator integrates with its own AI‑powered “Test Scheduler” that dynamically shards and orders jobs across a Kubernetes cluster. Both systems expose telemetry dashboards that show confidence scores, expected runtimes, and historical pass rates, giving release managers a clear view of how AI decisions translate into cycle‑time reductions.
Pro Tip
When enabling predictive testing, start by annotating critical paths in your repository with labels; the models learn faster and make more accurate selections.
Warning
Avoid over‑reliance on predictions during high‑impact releases—always run the full suite in a separate ‘sanity’ stage before production rollout.
Deep Dive Architecture
The core of predictive testing is a supervised model trained on a 6‑month window of commit‑test data. It outputs a probability that each test will fail given the diff. The pipeline then uses a cost‑benefit algorithm that balances expected runtime against failure probability, ensuring that the marginal cost of an extra test is outweighed by the risk reduction it offers.
Resource optimization is achieved by coupling predictions with a scheduler that assigns high‑confidence tests to low‑latency nodes and groups low‑confidence tests into shared containers. This reduces context switches and improves cache locality, yielding an average 35 % reduction in CPU usage per run.
| Feature | GitLab NextGen | CircleCI Orchestrator |
|---|---|---|
| Predictive Flag | `predictive: true` | Built‑in Scheduler |
| Scheduler Type | Static pool | Dynamic Kubernetes |
| Dashboard | Web UI | CLI + UI |
| Resource Optimization | Basic | Advanced sharding |
| Integration | GitLab CI | CircleCI Config |
Pros
- +Significant reduction in pipeline duration and resource consumption
- +Improved visibility into test value and risk
- +Scalable to multi‑service architectures
Cons
- -Requires continuous model retraining and data labeling
- -Potential bias toward historically flaky tests
- -Initial configuration overhead
Real-World Engineering Examples
- Spotify’s engineering team integrated GitLab NextGen’s predictive testing in 2024, slashing their nightly pipeline from 90 minutes to 55 minutes while maintaining a 99.9 % defect‑escape rate. Their dashboard now highlights the top 20 % of tests that cover 80 % of failure risk.
- Shopify adopted CircleCI Orchestrator’s AI scheduler for its global e‑commerce platform. By sharding test suites based on predicted failure likelihood, they reduced the average release cycle from 4.2 hours to 2.9 hours, allowing for twice‑weekly deployments during peak shopping seasons.
Pro Tip
By embedding AI‑driven test selection and dynamic scheduling, teams can cut cycle times by up to 40 % while keeping defect rates low—making the phrase “win this week” a regular reality rather than a rare event.
Quantum‑Inspired Optimization Wins
Quantum‑inspired optimization has moved from research labs into production, with D‑Wave’s Hybrid Solver and Azure Quantum’s QIO service delivering measurable gains in logistics and workforce scheduling.
By coupling quantum annealing with classical preprocessing, these platforms can explore combinatorial spaces that would cripple even the most tuned integer‑program solvers, turning weeks of manual tweaking into minutes of automated insight.
Pro Tip
Leverage the built‑in problem decomposition API to stay within the 500‑qubit limit and avoid costly re‑embedding cycles.
Warning
Do not feed dense constraint matrices directly into the solver; they trigger exponential embedding overhead and can exceed memory limits.
Deep Dive Architecture
The Hybrid Solver partitions a large QUBO into sub‑problems that fit the 5000‑qubit D‑Wave Advantage system, solves each sub‑QUBO on the annealer, and stitches the results together using a parallel tabu search on the host CPU. The workflow is orchestrated through the D‑Wave Ocean SDK, which automatically selects embedding strategies, tunes anneal times (typically 5‑20 µs), and performs post‑processing such as majority‑vote decoding.
Azure Quantum’s QIO service follows a similar divide‑and‑conquer pattern but abstracts the hardware layer entirely. Users submit a JSON‑encoded Ising model to the QIO API; the service dynamically chooses between simulated annealing, Fujitsu Digital Annealer, or D‑Wave hardware based on problem size, latency SLA, and cost budget. The result is returned with a confidence score that can be fed back into a classical optimizer for iterative refinement.
| Platform | Hardware Backend | Max QUBO Size | Typical Latency | Pricing Model |
|---|---|---|---|---|
| D‑Wave Hybrid Solver | Advantage System (5000 qubits) | ~10⁶ variables (via decomposition) | 3‑10 s per full solve | Pay‑per‑shot + compute time |
| Azure Quantum QIO | Choice of Simulated Annealing, Digital Annealer, D‑Wave | ~10⁶ variables (auto‑selected) | 1‑15 min depending on backend | Consumption‑based (core‑hour) |
| Classical Heuristics (Gurobi, CP‑Sat) | CPU/GPU clusters | ~10⁵ variables practical | 5‑30 min for large instances | License or cloud‑VM cost |
Pros
- +Can escape local minima that trap classical heuristics
- +Scales to problems with millions of variables via automatic decomposition
Cons
- -Quantum hardware access incurs higher per‑shot cost than pure classical cloud
- -Embedding overhead can dominate runtime for dense graphs
Real-World Engineering Examples
- A global automotive OEM reduced its spare‑parts distribution cost by 12 % after modeling the multi‑modal transport network as a QUBO and solving it with D‑Wave’s Hybrid Solver, cutting the planning horizon from 48 h to under 3 h.
- A major airline used Azure Quantum’s QIO to generate crew‑pairing schedules for a 10‑day horizon, achieving a 9 % reduction in dead‑head flights and saving roughly $3 M annually, with solution times under 10 minutes.
Pro Tip
Hybrid quantum‑inspired solvers turn combinatorial bottlenecks into tractable workloads, delivering real‑world cost and time savings that pure classical methods struggle to match.
Metaverse Collaboration Tools
Immersive collaboration platforms have moved from novelty to measurable productivity drivers in 2024‑2026, with Spatial XR Pro and Meta Horizon Workrooms leading the enterprise‑grade segment.
Both solutions blend spatial audio, persistent 3‑D whiteboards and AI‑generated meeting insights, enabling teams to quantify time‑to‑decision and reduce travel‑related carbon footprints.
Pro Tip
Leverage each platform’s native analytics API to auto‑populate your project management tool (e.g., Jira) with action items extracted from the session transcript.
Warning
Avoid over‑provisioning avatars; excessive polygon counts can degrade frame rates on older Quest 2 headsets, causing motion sickness and lowering participation.
Deep Dive Architecture
Spatial XR Pro integrates with Microsoft Teams via the ‘Live Share’ connector, allowing a Teams calendar invite to spawn a persistent Spatial room that retains whiteboard state across sessions. The platform’s Unity‑based SDK also supports custom 3‑D assets, enabling brand‑consistent environments.
Meta Horizon Workrooms introduced ‘Workroom Insights’ in 2025, which captures speech‑to‑text, sentiment analysis, and engagement heatmaps. These metrics are exposed through a GraphQL endpoint, so enterprises can build dashboards that correlate meeting length with downstream deliverable velocity.
| Feature | Spatial XR Pro | Meta Horizon Workrooms | Microsoft Mesh |
|---|---|---|---|
| Hardware Requirement | Quest 2+, HTC Vive Focus 3 | Quest 2+, Quest Pro | Any MR headset + PC |
| Persistent Whiteboard | Yes (Unity SDK) | Yes (cloud sync) | Yes (Azure) |
| AI Meeting Insights | Limited (partner integrations) | Full (speech‑to‑text, sentiment) | Basic (attendance) |
| Integration | Teams, Slack, Miro | Teams, Outlook | Teams, Azure DevOps |
| Pricing (2026) | $15/user/mo | $12/user/mo | $10/user/mo |
| Cross‑Platform | Windows/Mac/WebVR | Android/iOS (viewer) | Windows/Mac/Web |
Pros
- +High sense of presence with spatial audio and hand‑tracking
- +Built‑in AI analytics turn meetings into actionable data
Cons
- -Requires VR‑capable hardware; headset availability can be a bottleneck
- -Proprietary ecosystems limit cross‑platform asset sharing
Real-World Engineering Examples
- A global advertising agency used Spatial XR Pro for a multi‑city pitch; the 3‑D mood board reduced concept iteration cycles by 38% and eliminated three round‑trip flights.
- A Fortune 500 consulting firm piloted Horizon Workrooms for its quarterly strategy session, reporting a 22% cut in travel spend and a 15% faster decision‑making cadence, as verified by the Workroom Insights dashboard.
Pro Tip
When the immersive layer is paired with automated analytics, virtual meetings become quantifiable productivity wins, not just futuristic gimmicks.
Sustainable Tech Wins – Carbon‑Aware Computing
Carbon‑aware computing has become a core KPI for modern cloud ops teams. The Google Cloud Carbon‑Footprint API exposes real‑time CO₂e per request, while AWS Clean‑Energy Insights offers region‑level renewable‑energy ratios and carbon intensity forecasts. By instrumenting CI/CD pipelines to query these services before provisioning resources, teams can shift workloads to greener windows and instantly surface emission savings in dashboards or PR comments.
Both APIs deliver data at the job‑level granularity you need for micro‑services and serverless functions. For example, a batch job that runs 2 hours in the east‑US can be scheduled for the next 24 hours when the carbon intensity dips below 200 gCO₂e/kWh, reducing its footprint by up to 35 %. Quantifying these savings allows engineering managers to reward sustainable practices, align with ESG targets, and generate transparent win stories for stakeholders.
Pro Tip
Tag every cloud request with a 'sustainability' label and cache the API response for 5 minutes to avoid hitting rate limits during nightly builds.
Warning
Both services rely on third‑party grid data; for regions with incomplete reporting, the intensity numbers can be off by 10–20 %, so always cross‑check with local utility data before making critical scheduling decisions.
Deep Dive Architecture
Integrating the GCP Carbon‑Footprint API is a two‑step process: first, enable the API and create an OAuth2 service account; second, instrument the Compute Engine client to attach the 'carbon_footprint' header and parse the 'co2e' field in the response. The API returns a JSON payload with 'co2e' (grams), 'energy' (kWh), and 'timestamp'.
AWS Clean‑Energy Insights can be accessed via the CloudWatch metrics namespace 'AWS/CleanEnergy'. By querying the 'CarbonIntensity' metric with the 'AvailabilityZone' dimension, you receive the current and forecasted intensity. Combining this with the 'Cost' metric lets you compute cost‑per‑gCO₂e and prioritize green scheduling.
| Service | Data Granularity | Primary Metric | Pricing Model |
|---|---|---|---|
| GCP Carbon‑Footprint API | Job‑level | CO₂e per request | Free (quota) |
| AWS Clean‑Energy Insights | Region‑level | gCO₂e/kWh | Included in CloudWatch |
Pros
- +Real‑time, vendor‑native data reduces integration overhead
- +Built‑in dashboards and alerting streamline win reporting
Cons
- -API call costs and quotas can add operational overhead
- -Granularity limited to region/availability zone, not per‑instance
Real-World Engineering Examples
- TechCo, a fintech startup, integrated the GCP API into its nightly data‑pipeline. By shifting 40 % of its 200 GB ETL jobs to low‑intensity windows, it reported a 12 % reduction in monthly CO₂e and earned a spot in its annual ESG report.
- RetailCorp leveraged AWS Clean‑Energy Insights to orchestrate serverless order‑processing functions. The automated scheduler avoided peak‑intensity periods, cutting the team's cloud‑related emissions by 18 % while maintaining 99.99 % uptime.
Pro Tip
Embedding carbon metrics into the development lifecycle turns sustainability from a compliance checkbox into a measurable, celebrated win.
Future Outlook – Measuring and Scaling Wins
In 2026, the 'weekly win' evolves from a social ritual to a critical data asset within the engineering telemetry stack. Modern frameworks treat wins as structured events ingested via event-driven architectures, correlating CI/CD artifacts, SLO achievements, and cost optimization deltas. By leveraging LLM-based semantic extraction, organizations automatically parse PR descriptions, commit metadata, and incident post-mortems to identify high-impact contributions. This shifts win-tracking from manual reporting to continuous, low-friction signal detection, ensuring that every merged pull request or resolved P1 incident feeds directly into the organizational knowledge graph.
Scaling wins requires vector-based indexing to surface cross-team patterns and enable rapid replication. Advanced dashboards now visualize win density against DORA metrics, highlighting teams that consistently drive latency reductions or reliability gains. Agentic workflows automatically propagate verified wins to internal developer portals, suggesting code reuse opportunities and triggering recognition protocols. This closed-loop system transforms isolated successes into systemic leverage, allowing engineering leaders to quantify cultural health and technical velocity with the same rigor applied to production observability.
Pro Tip
Implement 'Win-as-Code' schemas in your repository metadata. Define JSON schemas for win events that include tags like #cost-savings, #latency-improvement, or #developer-experience. This enables automated aggregation and precise filtering without relying on unstructured text analysis.
Warning
Avoid 'metric gaming' by decoupling win recognition from individual performance reviews. When wins become tied to compensation, teams may inflate impact or fragment work to generate volume. Focus on collective outcome attribution and verify wins against objective telemetry (e.g., actual cloud bill reduction) to maintain integrity.
Deep Dive Architecture
Event Ingestion: Stream win events via Kafka or AWS EventBridge with schema validation using JSON Schema or Protobufs to ensure data consistency across microservices.
Semantic Retrieval: Embed win descriptions using high-dimensional vector models to enable natural language queries like 'Show me wins related to Kubernetes cost optimization in Q3.'
Replication Scoring: Calculate a 'Reuse Potential' score based on code complexity, dependency footprint, and business domain relevance to prioritize wins for internal library promotion.
| Feature | Manual Reporting | Dashboard Aggregation | AI-Augmented Framework |
|---|---|---|---|
| Data Source | Human input | API integrations | Event streams + LLM extraction |
| Latency | Weekly batch | Near-real-time | Real-time streaming |
| Actionability | Low | Medium | High (Auto-replication) |
Pros
- +Automates recognition, reducing developer friction.
- +Enables data-driven identification of high-leverage work.
- +Surfaces cross-team patterns for rapid knowledge transfer.
Cons
- -Risk of privacy leakage if sensitive details are indexed.
- -Requires robust schema governance to prevent noise.
- -May incentivize metric manipulation if not carefully designed.
Real-World Engineering Examples
- Netflix's Chaos Engineering wins are automatically tagged and linked to blast radius reductions, feeding directly into their resilience scorecards.
- Stripe's internal 'Wins' bot analyzes PR metadata to auto-draft weekly summaries for engineering managers, reducing reporting overhead by 90%.
Pro Tip
Treat wins as first-class telemetry. By automating ingestion, indexing, and propagation, you transform celebration into a scalable engine for technical acceleration and cultural alignment.
Frequently Asked Questions
How do you measure technical wins in a sprint?
What tools are best for tracking weekly dev progress?
Why is reflecting on weekly tech wins important for engineering teams?
Conclusion & Next Steps
Implementing a structured approach to tracking weekly technical wins transforms abstract development efforts into measurable outcomes. By leveraging CI/CD pipeline analytics, automated testing coverage reports, and infrastructure monitoring dashboards, engineering teams can objectively quantify progress. This data-driven methodology ensures that every merged pull request, optimized query, or deployed microservice contributes transparently to overarching system reliability and scalability goals.
Beyond raw metrics, the ritual of weekly technical reflection embeds continuous improvement into the development lifecycle. Sprint retrospectives paired with performance dashboards allow teams to dissect architectural decisions, refine deployment strategies, and celebrate incremental breakthroughs. This cyclical feedback loop not only accelerates feature delivery but also fosters a culture of accountability, where technical debt is proactively managed and innovation is systematically rewarded across the engineering organization.
Ultimately, consistently capturing and analyzing weekly tech wins creates a compounding advantage for modern software teams. As development cycles shrink and system complexity grows, maintaining a clear line of sight into engineering achievements becomes non-negotiable. By institutionalizing these tracking practices, organizations future-proof their technical operations, drive sustained developer productivity, and build resilient, high-performing systems ready to scale with market demands.
Stay Ahead of the Curve
Subscribe to our newsletter for more deep dives.
Was this architecture guide helpful?
Your feedback calibrates our editorial algorithms.
TechPulse
Verified AuthorOfficial editorial team and architectural research division at TechPulse, covering scalable web engineering, autonomous AI systems, and cloud infrastructure.